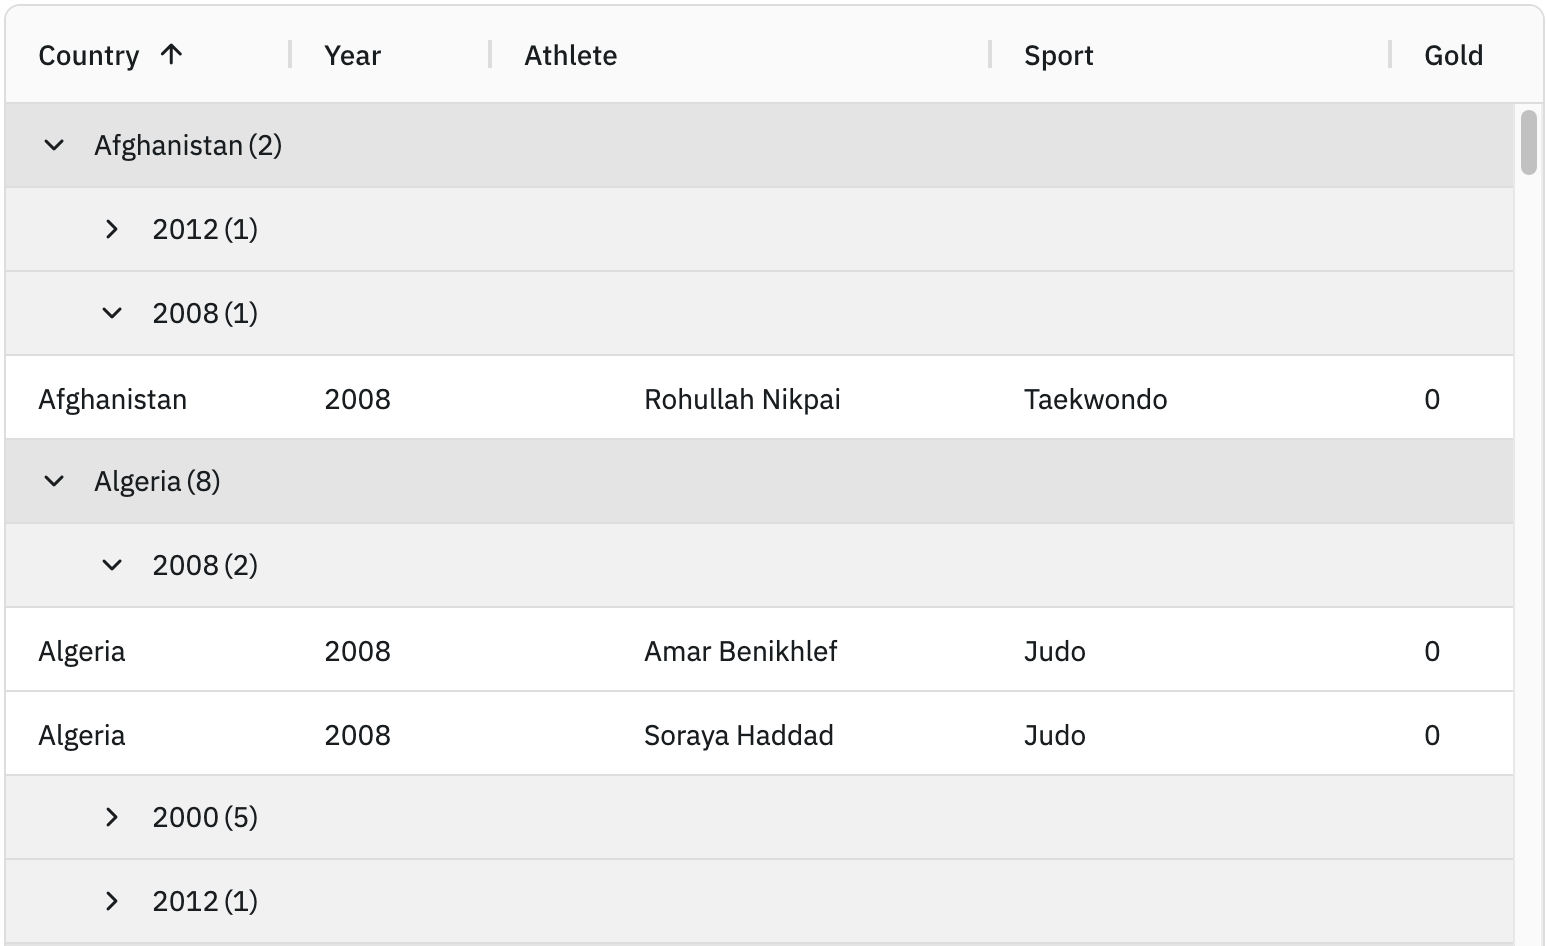
This section covers the Group Rows display type, where group rows are automatically added by the grid containing the row groups instead of group columns. This can be preferred if you have a lot of information you want to say about the group.

Enabling Group Rows
To display each row group using group rows set groupDisplayType = 'groupRows' as shown below:
const [columnDefs, setColumnDefs] = useState([
    { field: 'country', rowGroup: true, hide: true },
    { field: 'year', rowGroup: true, hide: true },
    { field: 'sport' },
    { field: 'total' }
]);

// display each row grouping in group rows
const groupDisplayType = 'groupRows';

<AgGridReact
    columnDefs={columnDefs}
    groupDisplayType={groupDisplayType}
/>
In the snippet above, rows will be grouped by country and year as both column definitions have rowGroup=true declared. These row groups will be displayed using Group Rows as groupDisplayType = 'groupRows'.
The example below demonstrates the Group Rows display type. Note the following:
There are two active row groups as the supplied
countryandyearcolumn definitions haverowGroup=truedeclared.Instead of group columns, the row groups are displayed using full width group rows as
groupDisplayType = 'groupRows'.The
countryandyearcolumns are not shown in the grid ashide=trueis set on their column definitions.Styling has been added to the group rows to highlight the different group levels.
Group Row Configuration
When using Group Rows, it is possible to change the rendering of the group row. This done by either replacing the Cell Renderer with your own Custom Cell Renderer, or configuring the provided Group Cell Renderer.
If using Group Rows and no groupRowRenderer properties are provided, then the default Group Cell Renderer is used with its default values.
// groups by row - the grid defaults to using the default group cell renderer for the row with default settings.
const groupDisplayType = 'groupRows';

<AgGridReact groupDisplayType={groupDisplayType} />
// identical to above - uses 'agGroupCellRenderer' which is the default, so doesn't change anything.
const groupDisplayType = 'groupRows';
const groupRowRenderer = 'agGroupCellRenderer';
<AgGridReact
groupDisplayType={groupDisplayType}
groupRowRenderer={groupRowRenderer}
/>Providing Cell Renderer
To provide your own Cell Renderer, use the grid properties groupRowRenderer and groupRowRendererParams.
Using your own Cell Renderer hands over rendering of the group row to your custom Cell Renderer. However, that also means the customer Cell Renderer will also need to provide expand / collapse functionality.
const gridOptions = {
    // configures Group Rows with a customer Cell Renderer
    groupDisplayType: 'groupRows',
    groupRowRenderer: myCellRenderer,
    groupRowRendererParams: {
        someProp: 'someValue',
    },
}
Configuring Group Cell Renderer
Configure the default Group Cell Renderer using groupRowRendererParams. Full details on what to configure are provided in the page Group Cell Renderer.
// use Group Rows and configure the Group Cell Renderer
const groupDisplayType = 'groupRows';
const groupRowRendererParams = {
    // puts a checkbox onto each group row
    checkbox: true,
    // puts a row dragger onto each group row
    rowDrag: true
};

<AgGridReact
    groupDisplayType={groupDisplayType}
    groupRowRendererParams={groupRowRendererParams}
/>
Below shows an example of aggregation with Group Rows. It also provides an innerRenderer to configure what gets displaying inside the row groups, however it keeps the Default Group Cell Renderer for its expand / collapse functionality. Note the following:
- Each group spans the width of the grid.
- Each group uses a custom Cell Renderer. The cell renderer shows the aggregation data for each medal type.
- Each medal column is editable, you can change the number of medals for any of the athletes.
- The column Year has a filter on it.
- The cell renderer has logic listening for changes to filtering and data cell changes. This means the aggregation data in the full width row is updated if: 1. If you edit any cell 1. If you filter the data (ie take rows out).
- The example shows how to use CSS to enable the row hover effect, which is not shown on full width rows by default.
Sorting Group Rows
To sort a group row, you can apply a sort to the underlying column. In the example below the Row Group Panel is enabled to demonstrate this. Note the following:
- Clicking on
countryin the row group panel applies a sort to the country row groups. - Holding the ⇧ Shift key down while clicking
yearin the row group panel applies a sort to the year row groups, while maintaining the sort on the country row groups.
Next Up
Continue to the next section to learn about the Custom Group Columns display type.