This section shows how Area Sparklines can be customised by overriding the default area options.
The following can be used to customise Area Sparklines:
Also see Additional Customisations for more advanced customisations that are common across all sparklines.
The snippet below shows option overrides for the Area Sparkline:
sparklineOptions: {
    type: 'area',
    fill: 'rgba(216, 204, 235, 0.3)',
    stroke: 'rgb(119,77,185)',
    marker: {
        enabled: true,
        size: 0,
        itemStyler: (params: any) => {
            if (params.highlightState === 'highlighted-item') {
                return {
                    size: 7
                };
            }
        }
    },
    highlight: {
        highlightedItem: {
            fill: 'rgb(143,185,77)',
            strokeWidth: 0,
        },
    },
    axis: {
        type: 'category',
        stroke: 'rgb(204, 204, 235)'
    }
}
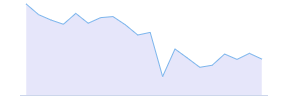
The following example demonstrates the results of the Area Sparkline options above:
Area Line Options Copy Link
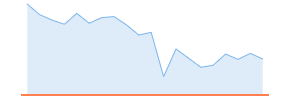
To apply custom stroke and strokeWidth attributes to the line, set these properties under line options as shown:
sparklineOptions: {
    type: 'area',
    // Customise the area line path in the area sparkline.
    stroke: 'orange',
    strokeWidth: 2
}
The result of the above configuration is displayed here.
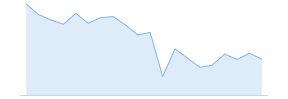
Default
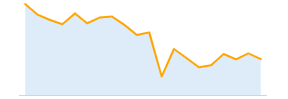
Custom line
Marker Options Copy Link
The markers are enabled by default but the size has been set to 0px, making them invisible.
The size property in the marker.itemStyler is 10px, allowing the markers to become visible when in the highlighted state.
These formats can be modified to your liking by setting the marker.itemStyler and highlight options as demonstrated below.
sparklineOptions: {
    type: 'area',
    marker: {
        enabled: true,
        size: 3,
        shape: 'circle', // Optional - marker shape is 'circle' by default.
        fill: 'green',
        stroke: 'green',
        strokeWidth: 2,
        itemStyler: (params) => {
            if (params.highlightState === 'highlighted-item') {
                return {
                    size: 10
                }
            }
        }
    },
    highlight: {
        highlightedItem: {
            fill: 'cyan',
            stroke: 'cyan',
        }
    },
}
- In the snippet above, we have configured the marker size to be
3px in the un-highlighted normal state, and10px in the highlighted state. - Note that the fill and stroke are also different depending on the highlighted state of the marker.
Here is the result of the configuration shown in the above snippet.
Default
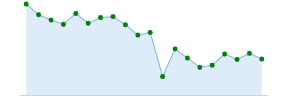
Custom marker
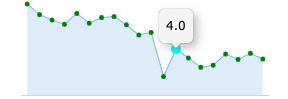
Custom highlighted marker
See AG Charts Series Markers for more information on marker options. See AG Charts Stylers for more information on item stylers.
Area Fill Options Copy Link
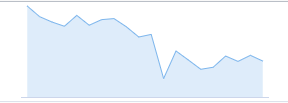
To change the color of the area between the data points and the axis line, add the fill property to sparklineOptions as shown in the code snippet below.
sparklineOptions: {
    type: 'area',
    fill: 'lavender', // sets the colour between the area line and axis
}
Here is the result of the configuration shown in the above snippet:
Default
Custom fill
The given fill string can be in one of the following formats:
#rgb- Short Hex Code#rrggbb- Hex Codergb(r, g, b)- RGBrgba(r, g, b, a)- RGB with an alpha channel- CSS color keyword - such as
aqua,orange, etc.
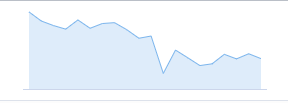
Axis Line Options Copy Link
By default, an axis line is displayed. This setting can be modified using the axis options.
See the code snippet below showing how to customise the axis line color and thickness.
sparklineOptions: {
    type: 'area',
    axis: {
        stroke: 'coral', // sets the axis line stroke
        strokeWidth: 3, // sets the axis line strokeWidth
    }
}
Here is the result of the configuration shown in the above snippet:
Default axis line
Custom axis line
It is possible to remove the axis line entirely by setting the axis strokeWidth to 0.
Sparkline Padding Options Copy Link
To add extra space around the sparklines, custom padding options can be applied as shown in the code snippet below.
sparklineOptions: {
    type: 'area',
    // sets the padding around the sparkline
    padding: {
        top: 10,
        right: 5,
        bottom: 10,
        left: 5
    },
}
Note that the top, right, bottom and left properties are all optional and can be modified independently.
Here is the result of the configuration shown in the above snippet:
Default padding
Custom padding
Additional Customisations Copy Link
More advanced customisations are discussed separately in the following sections:
- Axis - configure the axis type via
axisoptions. - Tooltips - configure tooltips using
tooltipoptions. - Points of Interest - configure individual points of interest using a
itemStyler.